Trending

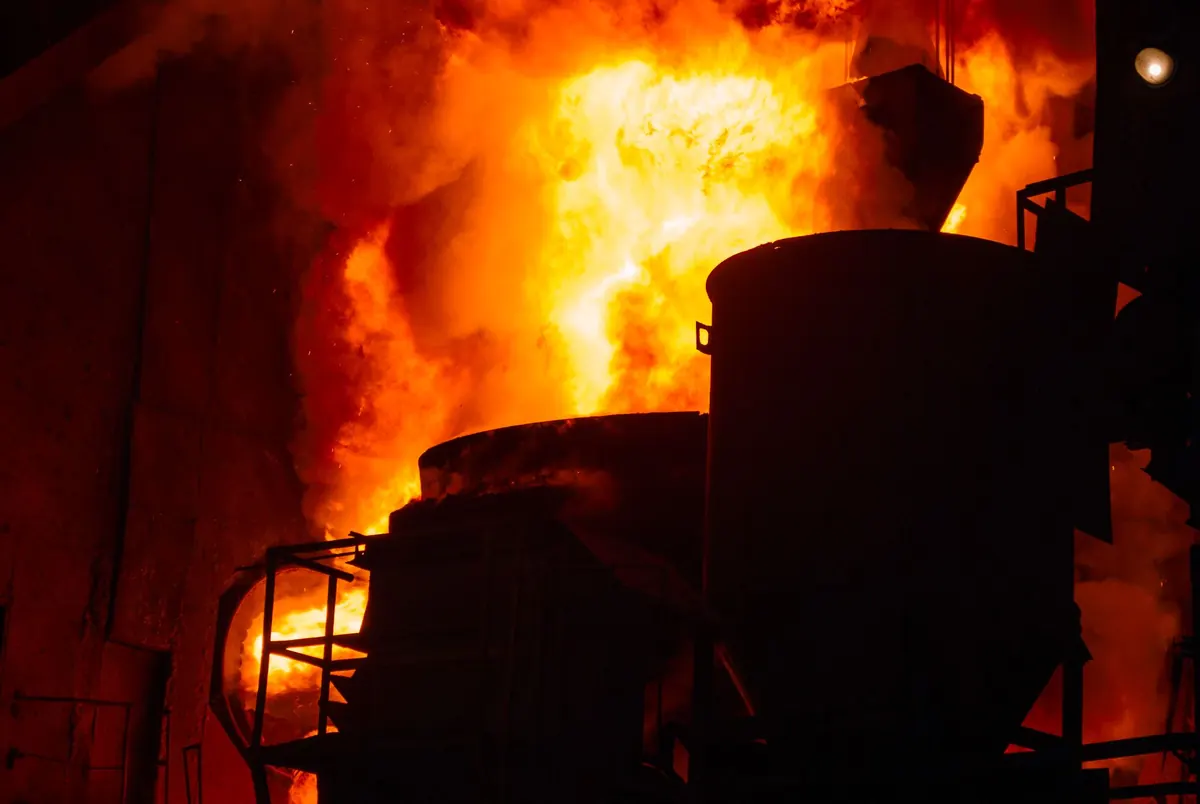
A flare is the last line of defence on most oil and gas sites. When gas can't be processed, sold or reinjected, it goes up the stack and burns. The flame looks reassuring from the fence line: bright, steady, doing its job. But a flame can look healthy and still pass a steady trickle of unburnt methane into the air above it. That trickle has a name — methane slip — and it matters far more than its modest volume suggests.
Combustion efficiency is the number that describes how well the flame finishes the job. Get it right and you have a defensible emissions figure. Get it wrong and you may be under-reporting your largest short-term climate impact without realising it.
Combustion efficiency (CE) is the share of the hydrocarbon fed to the flare that is converted into carbon dioxide and water. It is usually expressed as a percentage and applied at the flare tip.
Destruction and removal efficiency (DRE) is broader. It counts how much of the hydrocarbon is destroyed or removed from the gas stream, including the fraction that ends up as carbon monoxide, soot or other products of incomplete combustion rather than CO2. A flare can post a high CE and still emit more than you would like, because "burnt" and "cleanly burnt" are two different claims.
The figure you see quoted — 98%, 99% — is almost always a design assumption for a well-behaved flare, not a site measurement. It describes a flare with stable composition, sensible assist rates, adequate exit velocity and no liquid carryover. Change any of those and the real number moves.
Treat every efficiency figure you read as a question: measured or assumed? At the tip or across the whole flare system? Under which conditions, and for how long?
Slip is what survives the flame. Sometimes that is a little methane passing through the core untouched; sometimes it is a flame that has partially detached, guttered or gone out altogether. The usual culprits are well known to anyone who has stood at the base of a stack:
Methane is a potent but relatively short-lived greenhouse gas. On commonly used metrics it traps on the order of 80 times more heat than carbon dioxide over a 20-year window, before breaking down over roughly a decade. That combination — high potency, short life — is why a small percentage of slip against large flared volumes adds up to a serious mass of emissions, and why cutting it produces a faster climate benefit than almost any other single change on a site.
There are local consequences too. Poor combustion raises carbon monoxide, volatile organic compounds, nitrogen oxides and black carbon. Black carbon from smoking flares is a health concern for nearby communities and a visibility problem for operators.
Reporting expectations are shifting as well. Frameworks such as OGMP 2.0 and the EU Methane Regulation increasingly push operators towards measurement-informed inventories rather than a single default efficiency applied to every flare on the asset. If your inventory still assumes one number for all stacks, expect questions.
Ground-based or aircraft-mounted Fourier-transform infrared (FTIR) instruments measure what is actually in the plume downwind of the flare, in real time. Combine those concentrations with wind speed and plume geometry and you can derive a combustion efficiency for the moment of measurement. This is the closest thing to direct evidence, but it captures a snapshot, not a year.
A known rate of tracer — sulfur hexafluoride is the classic choice — is released with the flare gas. Downwind, the ratio of tracer to methane and other species tells you how much hydrocarbon survived. Tracer work is technically demanding but gives a defensible destruction efficiency figure for specific operating conditions.
Calculations from flare gas composition, flow rate, heating value, tip performance curves and assist ratios are fast, cheap and useful for screening and trending. Their weakness is obvious: they inherit every assumption baked into them.
Optical gas imaging cameras, drones and handheld sensors are excellent for finding problems — a smoking flare, a detached flame, a leaking pilot line — but they are not calibration-grade measurement devices. Use them to decide where to look harder.
Start by separating assumption from evidence. Write down what efficiency figure your inventory uses, where it came from and which flares it covers. Then compare that against what you actually see: assist rates against flow, flame appearance across a range of wind conditions, pilot status, knockout drum performance.
Trend rather than chase a single decimal place. Any measurement carries uncertainty, and comparing like-for-like campaigns over time will teach you more about your flares than one headline number. When you do quote an efficiency, say clearly whether it is combustion or destruction efficiency, whether it applies to a tip or a system, and what conditions it was taken under. That honesty is what turns a flaring figure from a formality into something you can act on.
Photo: Александр Лич / Pexels